
Slack Block Kit Charts: Line, Bar, Area and Pie, Tested
Slack messages can now carry real charts. We posted line, bar, area and pie charts and a sortable data table to a test workspace with a bot token, a webhook and a user token, and logged every limit Slack enforced.
To send a chart in a Slack message, post a data_visualization block with chat.postMessage or an incoming webhook. It draws a line, bar, area or pie chart from numbers in your JSON, so you no longer render a PNG and upload it. Slack added the block in June 2026, a month after the sortable data_table block. On 30 September 2026 we posted 29 chart and table payloads to a one-person test workspace and recorded what rendered and what Slack refused.
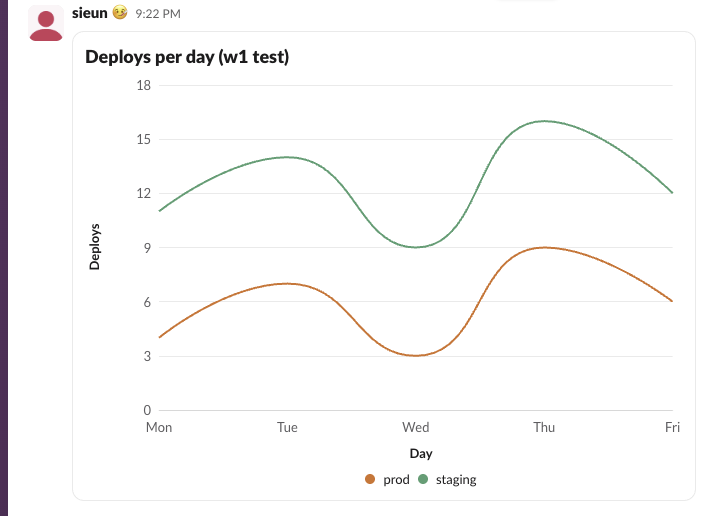
The smallest chart that works
This is the script we ran with a bot token that has chat:write. The same chart dict went to an incoming webhook in the second call:
import os
import requests
from slack_sdk import WebClient

client = WebClient(token=os.environ["SLACK_BOT_TOKEN"])
days = ["Mon", "Tue", "Wed", "Thu", "Fri"]
signups = [12, 18, 9, 22, 17]
chart = {
    "type": "data_visualization",
    "title": "Signups this week",
    "chart": {
        "type": "bar",
        "series": [{"name": "Signups", "data": [{"label": d, "value": v} for d, v in zip(days, signups)]}],
        "axis_config": {"categories": days, "y_label": "Signups"},
    },
}
resp = client.chat_postMessage(channel=os.environ["CHANNEL"], text="Signups this week: 78", blocks=[chart])
print("bot token:", resp["ok"], resp["ts"])

r = requests.post(os.environ["SLACK_WEBHOOK_URL"], json={"text": "Signups this week: 78", "blocks": [chart]}, timeout=30)
print("webhook:", r.status_code, r.text)
Output:
bot token: True 1790771328.614459
webhook: 200 ok
Both calls drew the chart, and so did chat.postMessage with a user token. Block Kit Builder also previews the block; it now has a Data Visualization entry in its left menu:
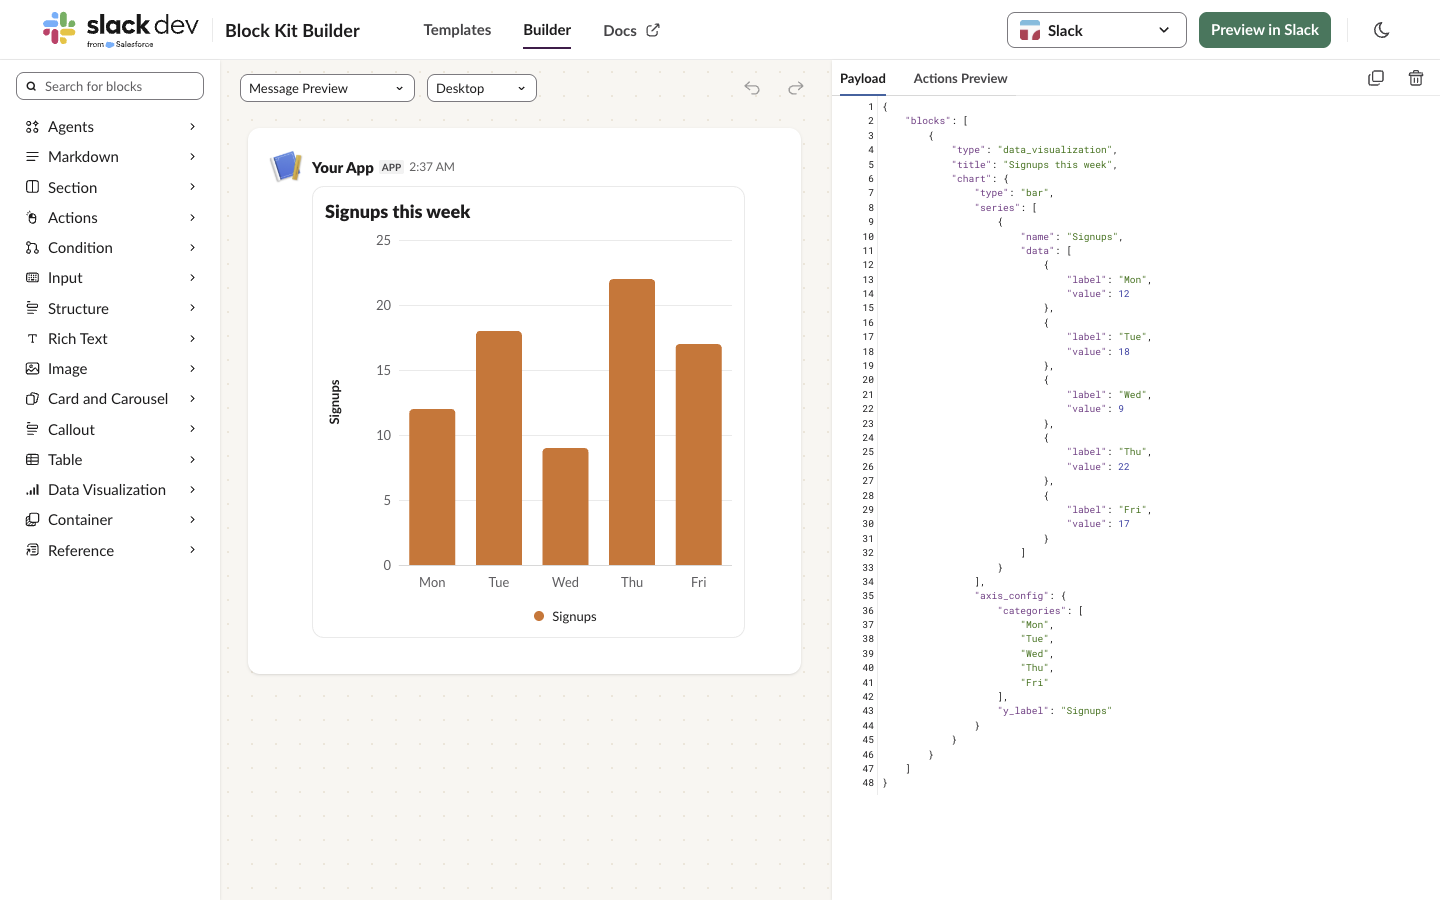
Three parts are required: title, chart.type, and, for line, bar and area, axis_config.categories. Each series needs one data point for every category, in any order; the categories array sets the order on the x axis.
The top-level text is what notifications and screen readers get. When we left it out, the post still succeeded and Slack stored the chart title ("Open incidents") as the message text, while slack_sdk printed a warning.
Bar, area and pie charts as Slack draws them
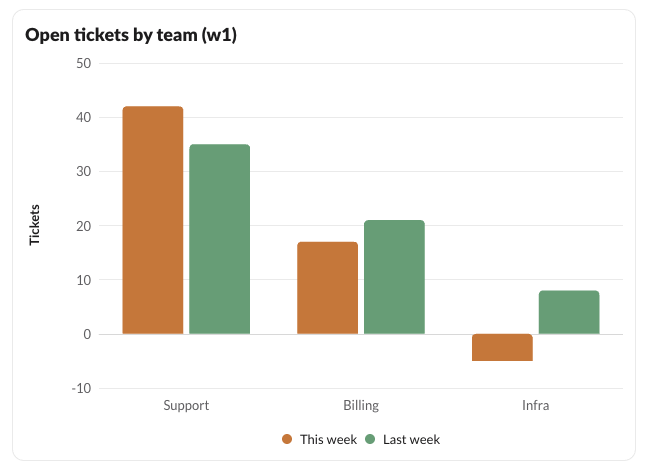
Bar charts group bars by category, one colour per series, and negative values go below the zero line. The Infra bar below is -5:
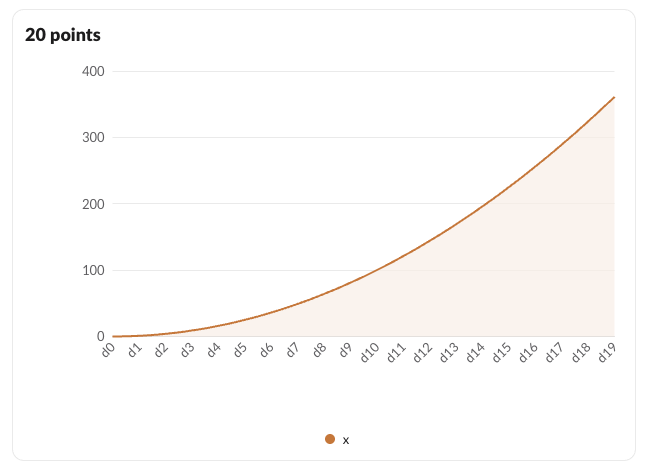
Area charts fill under each line. With 20 categories, the most Slack accepts, the x labels turn diagonal:
Pie charts take segments instead of series and axis_config. Slack works out the percentages from the values:
{"type": "data_visualization", "title": "Plan mix",
 "chart": {"type": "pie", "segments": [
   {"label": "Free", "value": 61}, {"label": "Pro", "value": 30}, {"label": "Business+", "value": 9}]}}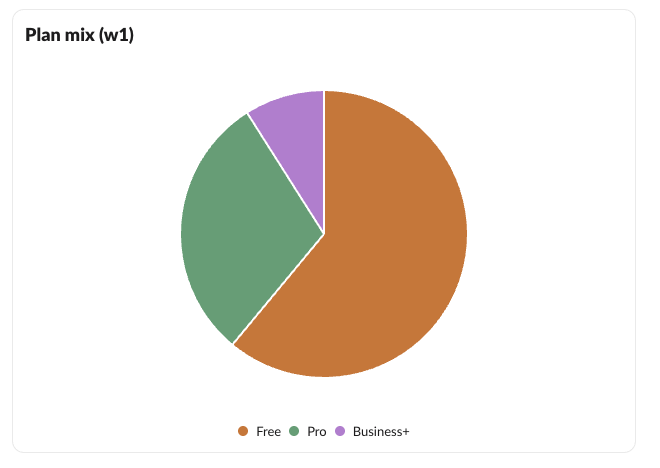
Slack's docs say a segment value must be greater than 0. A segment with value 0 was accepted anyway: it showed in the legend and drew no slice. Every line in all four chart types is smoothed into a curve, and we found no option to draw straight segments.
Never appear "away" on Slack again
Cloud-based. No downloads. Works 24/7 even when your laptop is off.
Limits Slack enforced, with the errors
Every rejected payload came back as invalid_blocks, with the reason in errors. These are the exact strings we got:
| What we sent | Result |
|---|---|
| 3 chart blocks in one message | A message can contain a maximum of 2 data_visualization blocks |
| Title of 51 characters | must be less than 51 characters [json-pointer:/blocks/0/title] |
| 13 series | failed to match exactly one allowed schema [json-pointer:/blocks/0/chart] |
| 21 categories | same schema error |
| 13 pie segments | same schema error |
| Category label of 21 characters | same schema error |
Line chart with no axis_config | same schema error |
"type": "scatter" | same schema error |
| A series missing one category | Series "x" must have exactly one data point for every category |
| Two series with the same name | Duplicate series name: x |
| 12 series, 20 categories, or a chart plus a data table | accepted |
The generic schema error names only /blocks/0/chart, not the field. If you see it, check these counts first: at most 12 series, 20 categories, 12 pie segments, and 20 characters per label or series name.
Charts update in place. We posted a line chart, then called chat.update with new values on the same ts, and the message redrew with the new last point. That makes one message per day a workable live dashboard.
The data_table block for rows of numbers
For the table part of a report, the data_table block gives a sortable, paged table. It is a different block from the older table block covered in how to make a table in Slack. Our 8-row table showed 5 rows and a pager, because page_size defaults to 5; hovering showed search, expand and menu buttons:
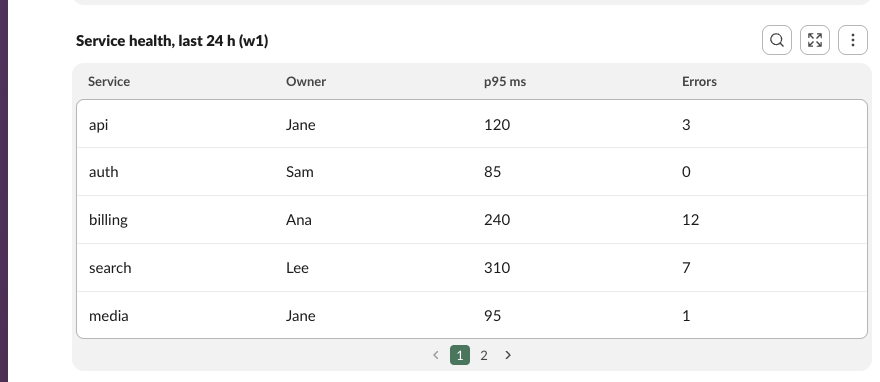
{"type": "data_table", "caption": "Service health, last 24 h",
 "rows": [
   [{"type": "raw_text", "text": "Service"}, {"type": "raw_text", "text": "p95 ms"}],
   [{"type": "raw_text", "text": "api"}, {"type": "raw_number", "value": 120, "text": "120"}]
 ]}
What the API refused:
| What we sent | Error |
|---|---|
No caption | missing required field: caption |
| Header plus 201 rows | no more than 201 items allowed |
page_size 101 | must be less than 100 (100 itself was accepted) |
| A row shorter than the header | uneven_table_rows_not_allowed |
A rich_text cell in the header row | data_table_header_cells_must_not_be_rich_text |
Header plus 200 rows went through. Columns made only of raw_number cells sort as numbers; mixed columns sort as text.
FAQ
Can I preview a chart before sending it?
Yes. Block Kit Builder draws it, as in the screenshot above. Post to a DM with yourself as well, because the error strings in the tables only come back from the real API.
What does a bad chart look like from a webhook?
The webhook answered our broken chart (no axis_config) with HTTP 400 and the plain-text body invalid_blocks, without the errors detail. Post the same blocks with chat.postMessage to see which field is wrong. How to read webhook errors is in the Slack webhook curl example.
Do I need a special scope?
No. chat:write for a bot token, or the incoming-webhook scope for a webhook URL, was enough. The bot token guide covers getting one.
Can a chart have clickable points or links?
The block's documented fields are only type, title, chart and block_id, so there is no place for actions or links. Put a button or link in a separate section or actions block under the chart.
Stop Jiggling Your Mouse.
Join hundreds of remote workers who never worry about their Slack status. Set it up once, stay green forever.
Related Articles
Slack chat.scheduleMessage: Limits and Errors We Measured
We called chat.scheduleMessage with a bot token for times from 10 seconds to 121 days ahead, listed and deleted the results, and watched which messages still arrived. The limits, the exact errors, and a delete that returned ok but did not stop the post.
Slack Invite Link Expiration: 30 Days, and How to Check One
Slack invite links expire after 30 days and have no longer option. We made links in a test workspace, deactivated them, and found a signed-out check that tells a live link from a dead one.
Slack Pinned Messages: Where Pins Are Now, and the 100-Pin Limit
In the current Slack desktop and web app, pinned messages sit in a Pins tab at the top of the channel. We pinned, edited, deleted and searched pins in a test workspace, and pinned messages until Slack refused the 101st.