
Grafana Slack Alerts: Webhook vs Bot Token, Templates, Tested
We sent Grafana alerts to Slack through both kinds of contact point, then replaced the default message with a notification template. The messages Slack showed, the delays, the template we used and the errors Grafana logged.
Grafana sends alerts to Slack through a Slack contact point, set up with either an incoming webhook URL or a bot token plus a channel. Both posted our alerts. With the webhook, every alert goes to the channel the webhook was made for. With a bot token you pick the channel in Grafana, and the messages come from your app's bot user. On 6 October 2026 we ran Grafana OSS 13.0.2 in Docker with a TestData data source, fired a real threshold alert into our free-plan test Slack workspace through both contact points, and then replaced the default message with a template.
Set up the contact point
In Grafana, go to Alerting > Contact points > + Add contact point, pick Slack, and fill in one of these:
- • Webhook URL. Create an incoming webhook in your Slack app (our webhook guide shows each screen) and paste the
https://hooks.slack.com/services/...URL. Leave Recipient and Token empty. - • Token and Recipient. Paste a bot token (
xoxb-) from an app withchat:write, and put a channel ID such asC0C7T45CQ1Win Recipient. Addchat:write.publicif the bot should post in public channels it has not joined.
Then point a notification policy at the contact point. We used the provisioning API with the same fields. Our policy grouped by alertname with group_wait 5s and group_interval 10s, so we did not wait minutes between tests.
The default message
Our rule took the last value of a TestData random walk and fired when it was above -1, so it fired on the first evaluation. The firing message reached Slack 23 seconds after we saved the rule, with a 10-second evaluation interval. After we raised the threshold, the resolved message came 5.9 seconds later.
The default message is a legacy attachment with a red (D63232) or green (36a64f) bar. The title is [FIRING:1] High CPU on web-1 sglab (warning web): the alert name, the folder, and the label values. The body lists the value, every label and annotation, and two links:
**Firing**

Value: B=42.106227940966946, C=1
Labels:
 - alertname = High CPU on web-1
 - grafana_folder = sglab
 - severity = warning
 - team = web
Annotations:
 - description = Test alert from a TestData random walk
 - summary = CPU above threshold on web-1
Source: <http://localhost:3000/alerting/grafana/sglab-cpu/view?orgId=1>
Silence: <http://localhost:3000/alerting/silence/new?...>
Two things in that message are wrong for most teams. First, Slack shows **Firing** with the asterisks, because Slack's bold is a single *. Second, the Source and Silence links pointed to http://localhost:3000, although we reached Grafana on another port. Grafana builds those links from its root_url setting. Set GF_SERVER_ROOT_URL (or root_url under [server]) to the address your team opens, or every link in Slack is dead.
Webhook or bot token: what changed
| Webhook URL | Bot token | |
|---|---|---|
| Channel | the one picked when the webhook was made | any channel ID in Recipient |
| Sender in Slack | the webhook's integration (subtype: bot_message) | your app's bot user |
| Resolved message | a new message | a new message |
| Threads or edits on resolve | no | no |
| Secret stored in Grafana | the webhook URL | the bot token |
Grafana 13 did not edit the firing message or reply in its thread in either mode. Each resolve was a separate message below the firing one. If you want one message per incident that changes color, Grafana's Slack contact point does not do it.
Never appear "away" on Slack again
Cloud-based. No downloads. Works 24/7 even when your laptop is off.
A custom notification template
Under Alerting > Contact points > Notification templates we added this template, named sglab:
{{ define "sglab.title" }}{{ if eq .Status "firing" }}:red_circle:{{ else }}:large_green_circle:{{ end }} {{ .CommonLabels.alertname }} ({{ len .Alerts.Firing }} firing){{ end }}
{{ define "sglab.text" }}{{ range .Alerts }}*{{ .Annotations.summary }}*
Severity: `{{ .Labels.severity }}`  Team: {{ .Labels.team }}
Value: {{ with .Values }}{{ printf "%.1f" .B }}{{ end }}
Started: {{ .StartsAt.Format "15:04:05 MST" }}
{{ end }}{{ end }}
Then, in the contact point's Optional Slack settings, we set Title to {{ template "sglab.title" . }} and Text Body to {{ template "sglab.text" . }}. The next alert used it. The first message below is the default; the other two came from the template:
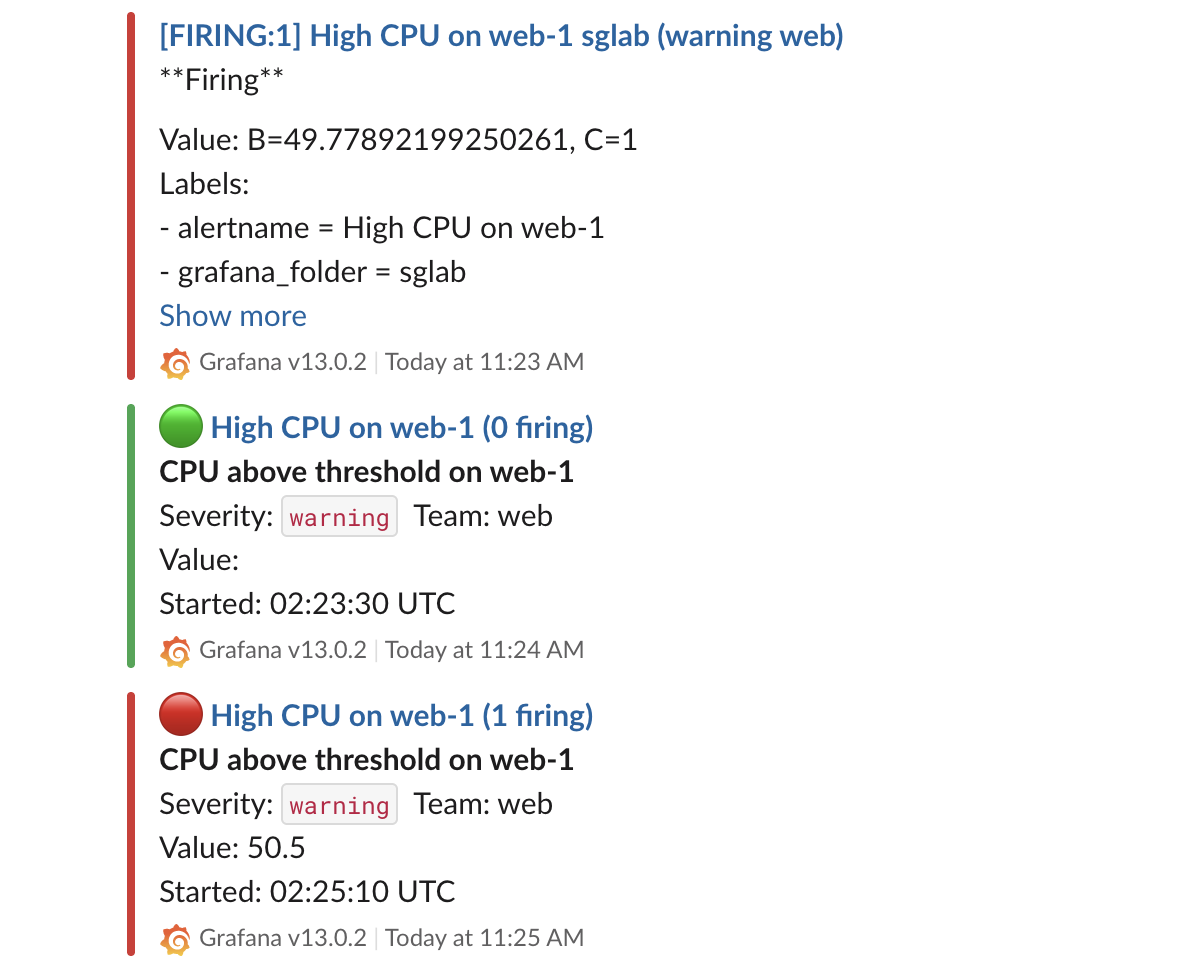
.Values is empty on a resolved alert, so our Value: line was blank there. Wrap that line in {{ if eq .Status "firing" }} if you do not want it. Use single asterisks for bold, and backticks for code, as in any Slack message formatting.
Errors we got
We pointed the bot-token contact point at a private channel the bot had not been invited to. Nothing reached Slack, and nothing in Grafana's alert list showed it. The contact point's status and the Grafana log had the error:
msg="Failed to send Slack message" err="failed to send request: channel_not_found"
msg="Notify for alerts failed" num_alerts=1 err="slack-bot/slack[0]: notify retry canceled due to unrecoverable error after 1 attempts: failed to send Slack message: failed to send request: channel_not_found"
Grafana tried again at every group interval, every 10 seconds in our setup, and got the same answer each time. Invite the bot to the private channel to fix it. channel_not_found is also what Slack returns for a wrong channel ID.
One more delay to know about: after we changed a contact point through the API, the next notification in two of our three tries still went out with the old settings. Wait for one more evaluation before you decide a change did not work.
FAQ
Can Grafana send to more than one Slack channel?
One Slack integration posts to one channel. Add a second Slack integration to the same contact point, or route labels to different contact points in the notification policy.
Can I use Block Kit in Grafana Slack alerts?
No. Grafana's docs say you can change the title and body with templates but not the layout, and the messages we got were attachments with text, not blocks.
Stop Jiggling Your Mouse.
Join hundreds of remote workers who never worry about their Slack status. Set it up once, stay green forever.
Related Articles
Alertmanager Slack Config: slack_configs Example and Templates, Tested
A tested alertmanager.yml for Slack, the messages Prometheus alerts produced, a custom title and text template, and what send_resolved, group_by and color changed. Plus a typo amtool did not catch.
Jenkins Slack Notification: slackSend Pipeline Tested with a Bot Token
We ran the Jenkins Slack Notification plugin against a real Slack app: the pipeline that worked, the botUser setting that makes slackSend fail with a 404, threads, Block Kit, and the errors for channels the bot cannot see.
n8n Slack Credentials: Bot Token, User Token or OAuth2, Tested
We ran 8 Slack node operations in n8n with a bot token, a user token and the OAuth2 credential. What each one can do, the errors you get, and two traps: the OAuth2 callback and the status expiration time zone.